Statistics
The following statistics from the U. S. Census of 2000 portray Minnesota’s cultural diversity by race and then by ethnicity.
![]() Black/Africian American 3.5%
Black/Africian American 3.5%
![]() American Indian/Alaskan Native 1.1%
American Indian/Alaskan Native 1.1%
![]() Asian/Pacific Islander 2.9%
Asian/Pacific Islander 2.9%
![]() Other races 1.3%
Other races 1.3%
![]() Two or more races 1.7%
Two or more races 1.7%
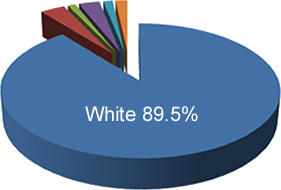
Definitions: One Race: For the race categories of White, Black/African American, American Indian/Alaskan Native, Asian/Pacific Islander and Some Other Race the respondent selected ONLY that category. Two or More Races: Represents all respondents who reported more than one race.
Source: U.S From Demographics Table 2: Minnesota Population by Race and Ethnicity by State and County, 2000. The exact table contains all counties in Minnesota is also found in the 2002 Minnesota County Health Tables on the Department of Health website.
Ethnicity in Minnesota: The responder can be of any race.
![]() Hispanics 2.9%
Hispanics 2.9%
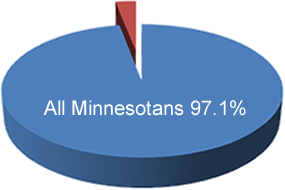
While “Hispanic” is not considered a separate race, and they are not represented in the “Race and Ethnicity” graph to the left, their numbers in Minnesota are still significant.
Source: Census Bureau: 2000 Census of the Population, www.census.gov